Electrically Charged Particle Model Lab
Brooke Miller, Gabrielle Murphy, Katie O'Byrne, Ryan Partain
Objective: To find the graphical and mathematical relationship between potential and current in a light bulb and two different colored resistors.
Apparatus

Materials:
Battery
Lightbulb
Switch
Dimmer Switch
Resistors (Blue and Green)
Lightbulb
Switch
Dimmer Switch
Resistors (Blue and Green)
Multimeter
Procedure:
1. Create a circuit on the board with the battery, switch, dimmer switch, and bulb connected by wires. Put the dimmer switch on the highest setting.
2. Open the switch to break the circuit. Measure the current across the open switch using the multimeter.
3. Close the switch to close the circuit.
4. Measure the potential drop across the light bulb using the multimeter.
5. Turn the dial on the dimmer switch to the second highest setting and repeat steps 2-4.
6. Repeat steps 2-4 with all the spots on the dial.
7. Take out the bulb and replace it with the green wire (resistor).
8. Repeat steps 2-6 with the green wire.
9. Take out the green wire and replace it with the blue wire (resistor).
10. Repeat steps 2-6 with the blue wire.
Data
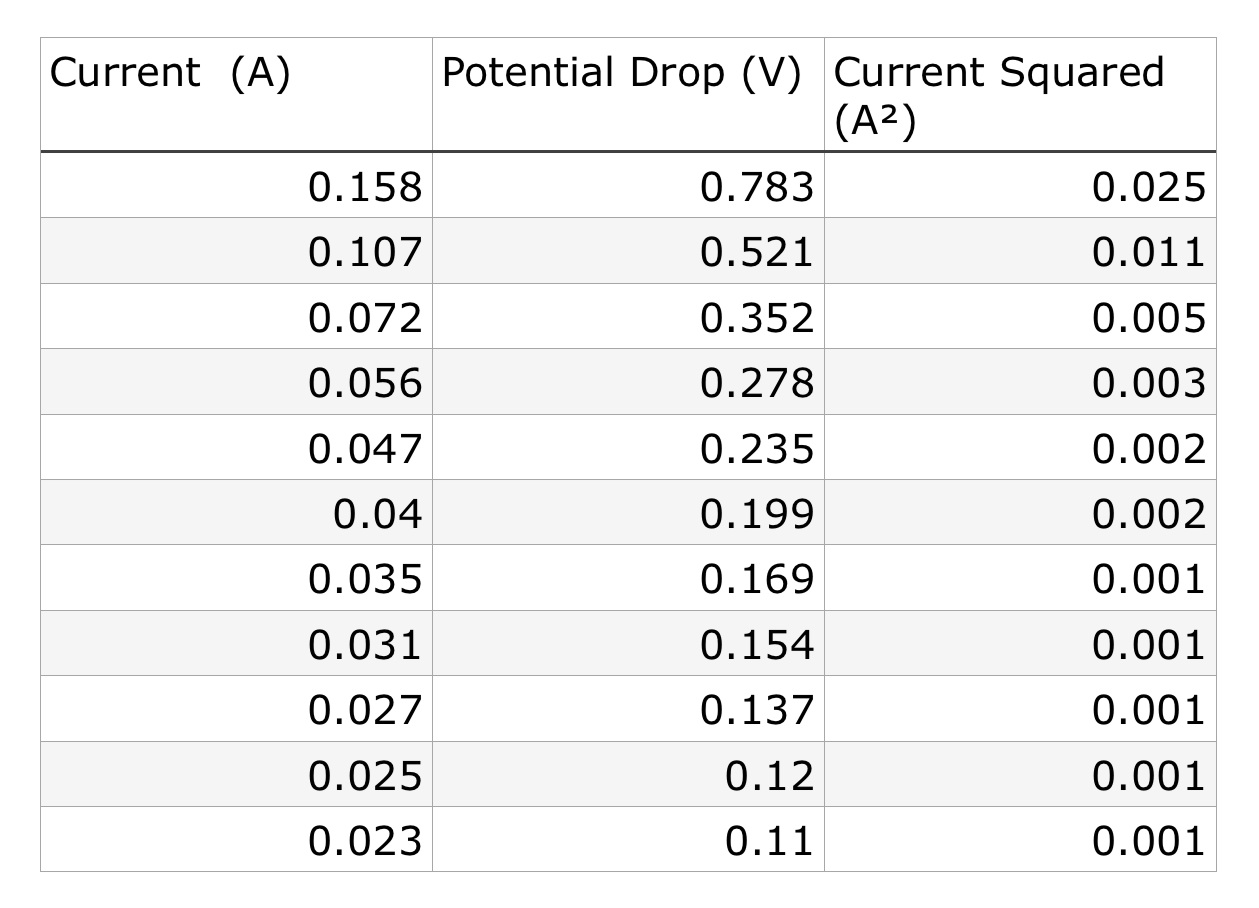
Circuit with Light Bulb

Circuit with Green Resistor
Circuit with Blue Resistor

Data Analysis
Lightbulb

Lightbulb Linearized

V=(49.71 V/A2) I2
Blue Wire

V= (9.837 V/A) I
Green Wire

V= (4.937 V/A) I
Conclusion
With the light bulb in the circuit, the potential vs. current graph formed produces a parabolic shape. In order to linearize the data we squared the current. The line gave us the equation V= (49.71 V/A2) I2 where V is potential drop, I is current and the y-intercept is where the current equals zero but is close enough to zero that it is negligible. The slope of the graph represents how difficult it is for the current to move through the circuit, or the resistance present within the circuit.
With the different resistors in the circuit, the potential versus current graphs produce a straight line. As with the experiment with the light bulb, the slope of the line represents the resistance of the wire. The difference between the green and blue resistors were their slopes, or the resistance within the system; the green wire had a resistance of 5 ohms or (V/A) and the blue wire had a resistance of 10 ohms. This gives us the equations V=(4.937 V/A) I and V= (9.837 V/A) I respectively.
The general equation found for both the blue and green wires is V=IR, where V is the potential drop, I is the current, and R, the slope, is the resistance.
The blue and green resistors have a linear relationship between voltage and current. The graph of the voltage vs current in the light bulb forms a parabolic shape with a changing slope. This difference between the slopes of the green and blue wires and a light bulb because a light bulb is not a “fixed resistor.” While the currents flowing through the systems in each trial are similar throughout all three experiments and the battery is the same, the resistance changes in each trial of each experiment depending on the dimmer switch, which adds resistance. When fixed resistors such as the wires are part of the circuit, the resistance of the wires don’t change even when resistance is changed with the dimmer switch.
Some sources of error could have been that the resistor did not function as well as planned and it had a larger percent error than predicted. The multimeter used also might have been slightly inaccurate and measured incorrect numbers. Energy might have been taken out of the system through heat. The voltage is also slightly lower than expected because potential is lost in the movement across the wires and as the battery continues to power the circuit.