Ryan Partain, Trey Seabrooke, Tyler Kolby, Daniel Hanna
Mechanical Wave Model Lab
Objective: to determine the graphical and mathematical relationship between velocity and amplitude, velocity and length of the pulse, velocity and distance, and velocity and force.
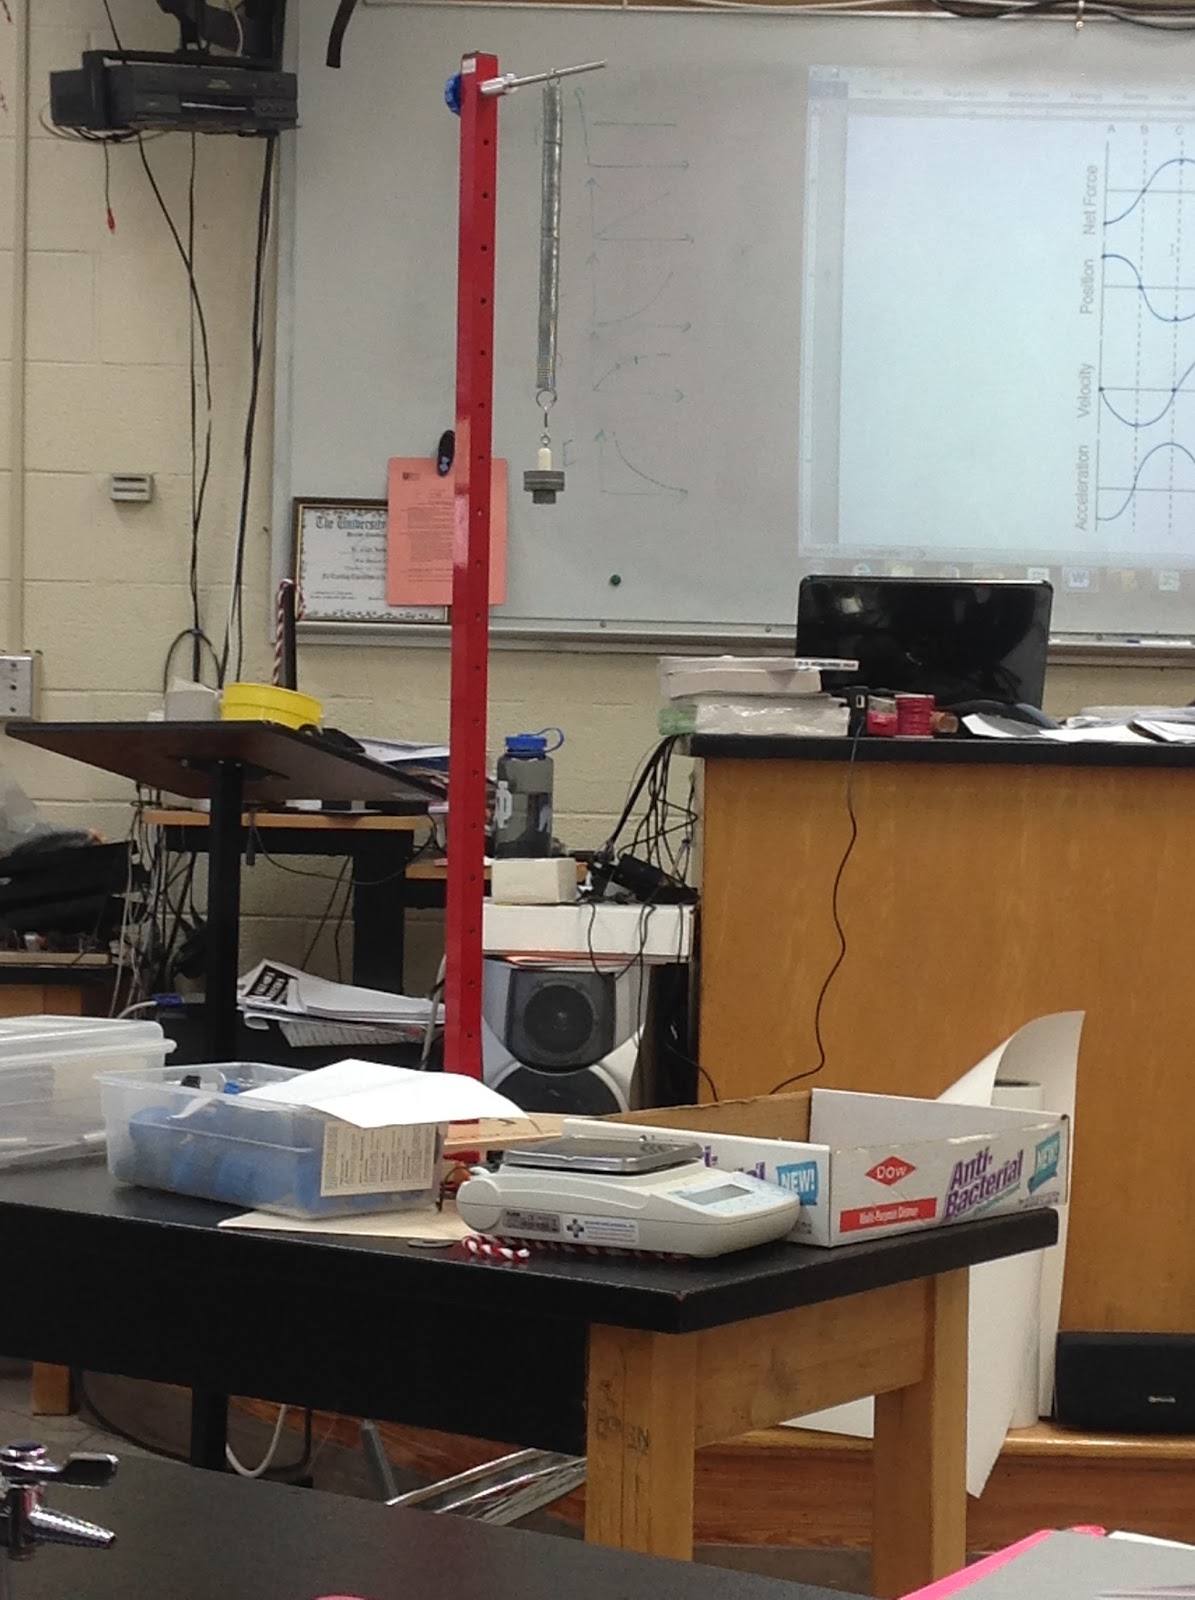
Picture of Apparatus:
Materials:
- Distance measurement device
- Spring of length greater than ~1 meter
- Timer
- Force measuring device
Procedure:
To begin, obtain all materials listed above. Lay the spring flat on the ground. Straighten the spring but do not stretch the spring, and record the length of the spring in a straight line.
First record data for the relationship of velocity vs. amplitude. Position the spring at a slightly stretched position and record the length. Two group members are holding the stretched spring at their fixed positions. One group member places his or her foot next to the spring ~1 foot from their end of the spring. The portion of the spring in between the group members foot and the fixed end will now be used to create the amplitude for the pulse. Keep the foot at the same position and change the distance you pull the middle portion of the spring. Record the time it takes for the pulse to go to the other end and return.
Next record data for velocity vs. pulse length. The same setup is used as previously. For this experiment, keep the amplitude constant and move the group members foot at various distances. Record the distances and corresponding time for the pulse to return.
Next, to record velocity vs. distance hold the spring length constant and setup the same as before. Instead of timing the pulse from start to return, now time the pulse from start to half length, start to full length, start to full and one half length, and start two two full lengths to record any change in velocity.
Finally use a force measuring device to determine the force on the spring by the fixed end. Move the spring to get various force values and record the time for the pulse from start to return to determine velocity for each value. Keep the amplitude and pulse length constant.
Data Table:

Graphs:
Velocity vs. Amplitude

Velocity vs. Pulse Length

Velocity vs. Distance

Velocity vs. Force

Conclusion: (no relationship in any except V vs. F. Despite what appears to be a linear relationship, the data set accidentally followed that general trend, but the numbers were scattered. Due to experimental error, the data appears to have a relationship despite having none)
In the graph of V vs. F, the relationship is parabolic; therefore V is squared to linearize making the graph V^2 vs. F. Based on this graph we see the relationship V^2=( m/kg)F.
Sources of error include difficulty in pinpointing the exact time one wavelength has traveled the entire length of the spring, and difficulty in keeping the spring in the exact same position throughout the experimental trials. The procedure could be improved if there were more stable fixed positions at the ends of the spring. It could also be improved if the pulses were more accurately recorded. For example, using ones foot works but contributes in error of the experiment due to the width of the foot in contact with the spring.