Ryan Partain, Tyler Kolby, Daniel Hanna, Trey Seabrooke
Oscillating Particle Lab
Objective: To determine the graphical and mathematical relationships among mass, amplitude, spring constant, and period for a bouncing mass hanging by a spring.
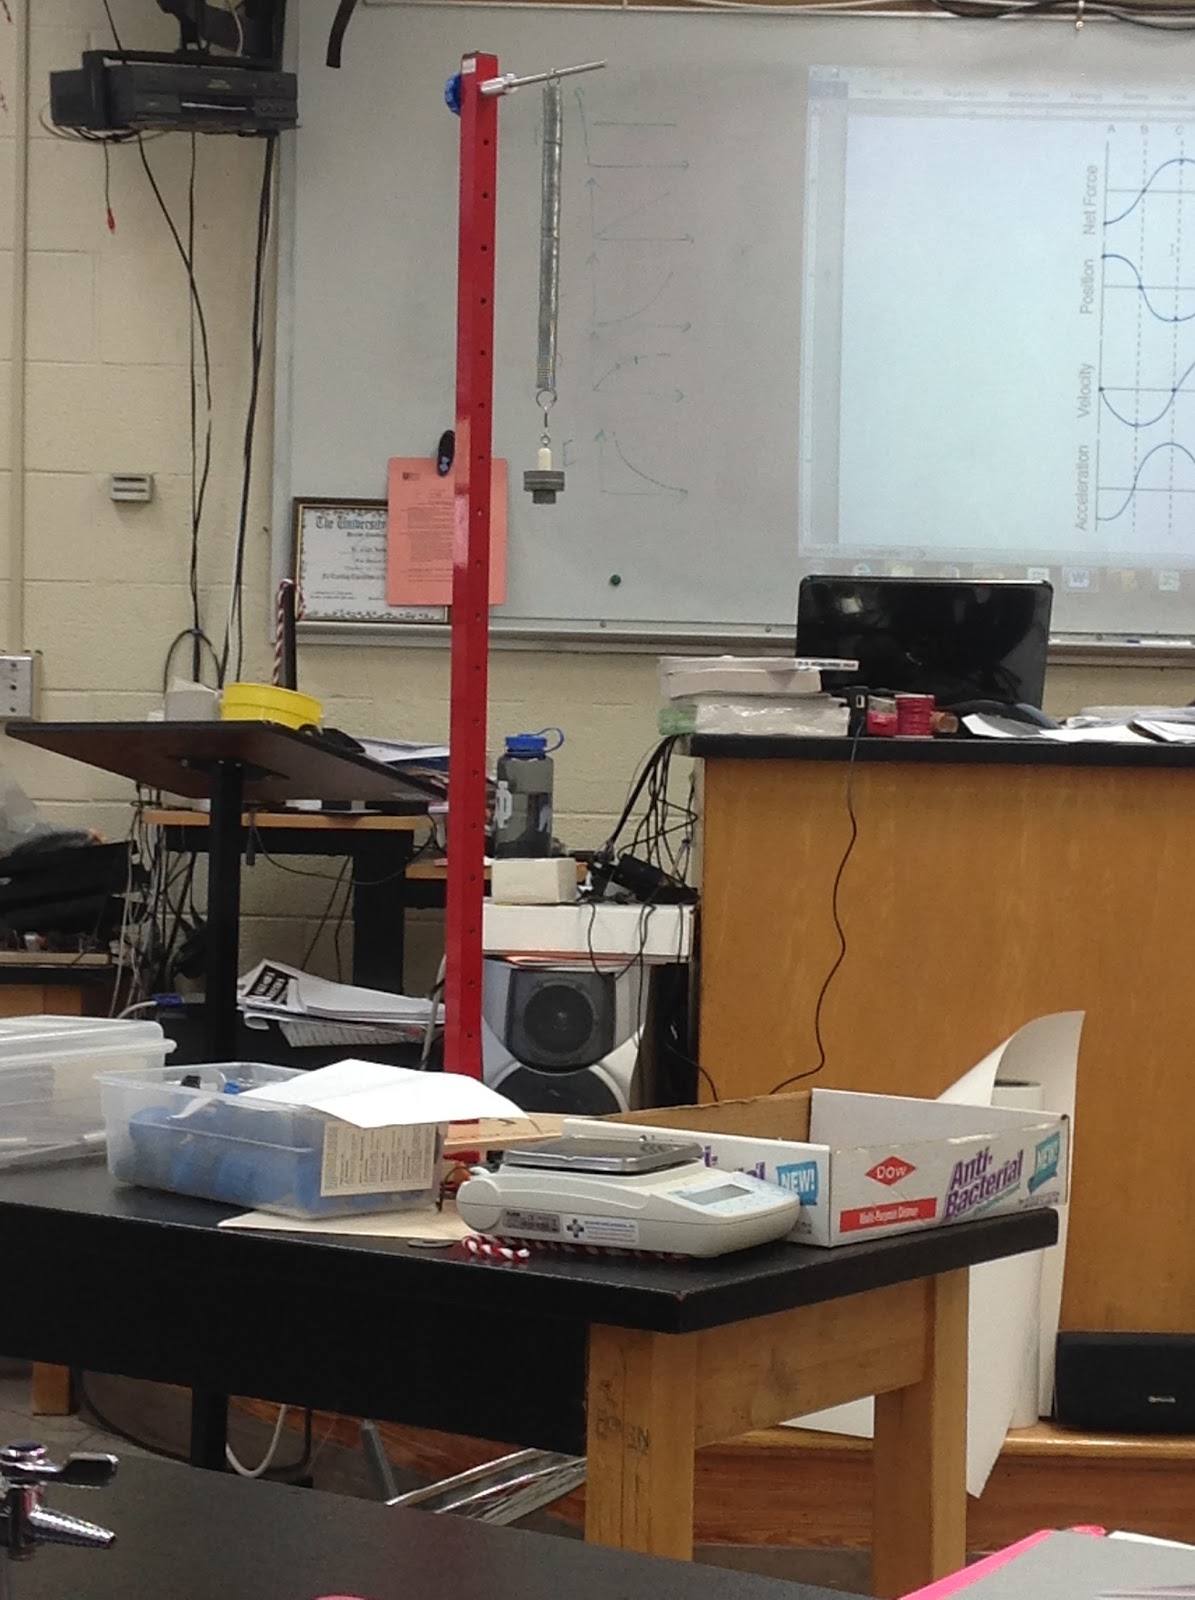
Picture of Apparatus:
Materials:
- Spring
- Stand w/ latch
- Hanging mass
- 10 Washers
- Timer
- Ruler
- Electronic Balance
Procedure:
Obtain all materials listed above and set up the materials to resemble the picture of the apparatus above.
Begin data collection for the various quantities listed in the objective.
To determine force vs. height, set up the apparatus like pictured, and allow the hanging mass to hang freely without oscillation. Record the distance the spring is stretched. Repeat this for 8-10 different masses.
To determine mass vs. period, set up the apparatus like pictures, and allow the hanging mass to hang freely, then stretch the spring to allow oscillation. Keep the amplitude, or distance you stretch the spring constant and record the time of 10 oscillations to find the period for 8-10 different masses.
To determine amplitude vs. period, keep the hanging mass constant. Stretch the spring and record the time for 10 oscillations. Stretch the spring every half centimeter from .5cm to 6cm.
To determine period vs. spring constant, calculate your group's k value from the force vs. height graph and then combine your k with every other group to get the values for the graph.
Data Table:

Graphs:
Force vs. Height

Period vs. Mass

Period^2 vs. Mass

Period vs. Amplitude

Period vs. Spring Constant

Period vs. 1/Spring Constant

Period^2 vs. 1/Spring Constant

Conclusion: For the graph of weight vs. extension, the relationship is linear and the slope is the k value or spring constant.
For the graph of period vs. mass, the relationship is parabolic. The period is squared to linearize this graph.
For the graph of period vs. amplitude, there is no relationship.
For the graph of period vs. spring constant, the relationship is inverse. The inverse of the spring constant is taken and the relationship is parabolic. The period is then squared to linearize the graph.
Based on the relationships we see in our graphs, we see the relationship that T(period)=2π(the square root of (m/k))
When experimenting, the timekeeping is a source of error because one person has to communicate to the other that the particle has oscillated ten times (in our case) in order for him to stop the time. Another source of error is that it is difficult to pinpoint exactly when the particle reaches the end of its period making timing more inconsistent and slightly less accurate.Using a motion detector to track the particle would be more effective and accurate in this experiment because it can keep accurate time and also knows exactly when ten periods have elapsed when it's data is graphed.
No comments:
Post a Comment